Measurement & Detection for Critical System Diagnostics: A Maintenance Team's Practical Guide to Southeast Asia Operations
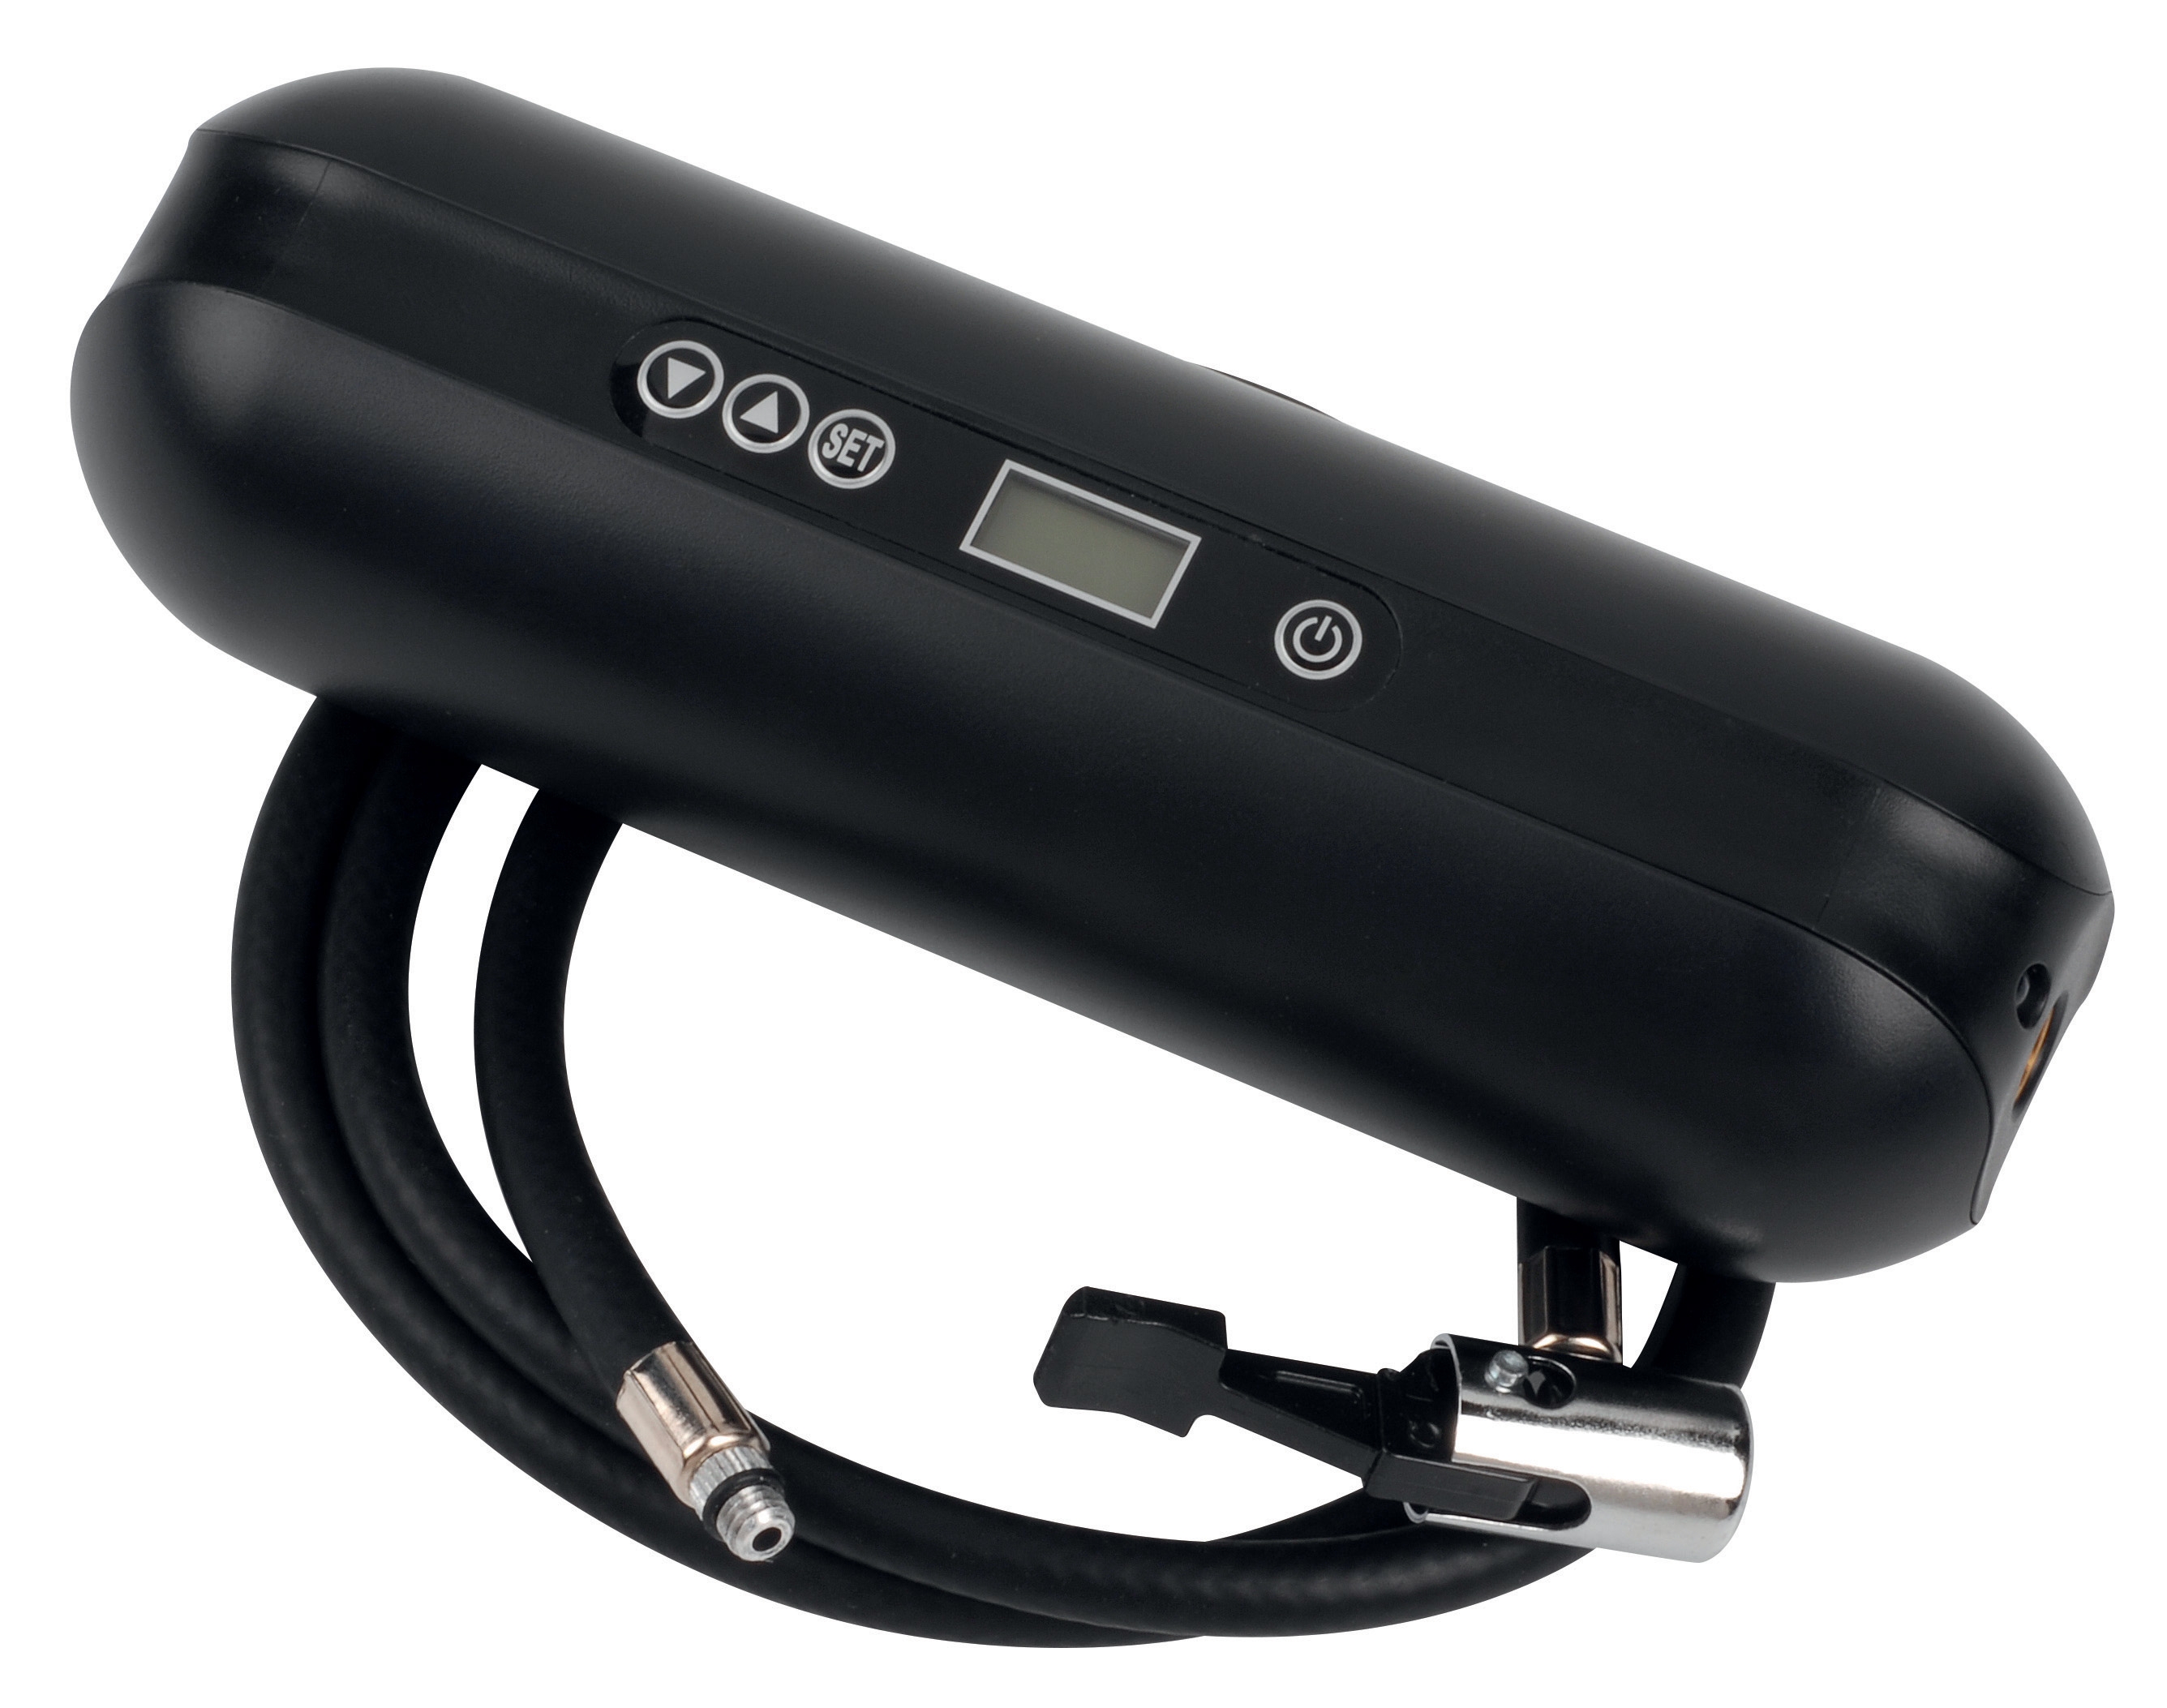
Table of Contentsexpand_more
Introduction: Measurement & Detection for Proactive Maintenance in Southeast Asia
Maintenance teams in Southeast Asia operate in demanding tropical and subtropical conditions where humidity, temperature fluctuations, and corrosive environments accelerate equipment degradation. Measurement & Detection technologies form the foundation of effective diagnostic protocols that prevent catastrophic failures rather than react to them.
With 35+ years of experience distributing industrial equipment across the region, 3G Electric has observed that teams using structured measurement and detection protocols reduce unplanned downtime by up to 40%. This guide translates that expertise into actionable workflows specifically designed for maintenance personnel working on HVAC, pressure, and flow systems in high-humidity, high-temperature environments.
Section 1: Establishing Baseline Measurements for Your Equipment Portfolio
Why Baseline Data Matters
Before you can detect abnormal system behavior, you must establish what "normal" looks like for your specific equipment and environmental conditions. Baseline measurements create a reference point against which future readings are compared—the cornerstone of any predictive maintenance program.
In Southeast Asia's tropical climate, baseline measurements must account for seasonal variations. Temperature swings of 15-20°C between rainy and dry seasons, coupled with humidity levels regularly exceeding 80%, create natural drift in system readings. Your baseline should reflect these normal variations so you can distinguish genuine equipment degradation from environmental noise.
Practical Baseline Protocol
Step 1: Document Current Operating Conditions
- Record ambient temperature, humidity, and barometric pressure during baseline establishment
- Measure system parameters (pressure, temperature, flow) under standardized load conditions
- Capture readings at three time intervals: morning, midday, and evening to account for thermal cycling
- Document equipment age, installation date, and any recent modifications
Temperature baseline measurements require precise instrumentation. The Dwyer Probe AVG PT100 OHM RTD L.65 AVG-21241 provides ±0.6% accuracy across industrial temperature ranges, essential for establishing reliable baselines in Southeast Asia's variable climate. Mount these probes at:
- System inlet points
- System outlet points
- Ambient reference locations outside equipment enclosures
Record readings weekly for 12 weeks to capture seasonal variations. This extended period accounts for the monsoon transition periods common in the region.
Step 3: Establish Pressure Baselines
Pressure readings form the diagnostic backbone of most industrial systems. Use the Preciman Stainless steel vertical pressure gauge D63 0/+40Mbar G1/4 for low-pressure system monitoring. The stainless steel construction resists corrosion from Southeast Asia's salt-laden coastal air and high humidity.
For systems requiring expansion tank monitoring, the CBM Expansion tank inflator battery 2000 mAH enables precise pressure verification and pre-charge confirmation. Record:
- System pressure under no-load conditions
- System pressure at 50% load
- System pressure at 100% load
- Temperature-corrected pressure readings
Flow diagnostics often reveal system imbalances before pressure or temperature anomalies appear. The Dwyer Metal average flow probe MAFS-16 measures static and total pressure across multiple points, providing data about flow distribution and blockage potential.
Capture flow measurements at:
- Primary distribution points
- Secondary branch connections
- Return or exhaust points
Document both static and dynamic pressure readings. This dual-measurement approach reveals whether changes in flow are caused by system degradation or intentional operational adjustments.
Section 2: Implementing Real-Time Monitoring and Alert Protocols
Transitioning from Static Baselines to Continuous Monitoring
Once baselines are established, maintenance teams should implement continuous or semi-continuous monitoring for critical system parameters. This shift from periodic measurement to ongoing detection enables early identification of degradation trends before they reach failure thresholds.
Pressure Transmitter Integration for Differential Monitoring
The Dwyer Transmitter 616KD-13V-TC provides differential pressure measurement capability essential for detecting:
- Filter blockage (pressure increase across filter elements)
- Coil fouling (differential pressure increase across heat exchangers)
- Ducting or piping obstructions
- Valve restriction or failure
1. Identify measurement points: Most HVAC and pressure systems benefit from differential pressure measurement across major components
2. Install barbed process connections: The 616KD-13V-TC accepts 3-5 mm tubing, enabling flexible routing around equipment
3. Configure measurement range: The 0–1 IN W.C. range suits most HVAC applications; verify your system's expected differential pressure falls within this range
4. Establish alert thresholds: Set differential pressure alarms at 70% of maximum operating differential pressure
Alert Protocol Development:
- Green zone (0-50% of baseline): Normal operation
- Yellow zone (50-75% of baseline): Scheduled monitoring increase; plan maintenance within 30 days
- Red zone (75-100% of baseline): Immediate investigation required; plan maintenance within 7 days
- Critical (>100% of baseline): Equipment shutdown and emergency maintenance
This three-tiered approach prevents alert fatigue while ensuring significant degradation receives appropriate response urgency.
Environmental Compensation in Tropical Conditions
Southeast Asia's environmental variability requires adjustment protocols:
- Adjust pressure readings for barometric pressure changes (required in coastal and high-elevation areas)
- Apply temperature compensation to all pressure measurements using documented temperature coefficients
- Account for humidity effects on electrical measurement devices; calibrate monthly in high-humidity locations
Section 3: Diagnostic Workflows for Common System Failures
Temperature Anomaly Investigation
Symptom: Temperature readings deviate ±5°C from baseline under standard conditions
Diagnostic Sequence:
1. Verify ambient temperature and humidity using calibrated instruments
2. Confirm sensor accuracy: Cross-reference PT100 RTD probe readings against a known reference
3. Measure temperature at three system points (inlet, outlet, return)
4. Calculate temperature differential; compare against system design specifications
5. Investigate root causes:
- Inadequate heat transfer: fouling, blockage, or scale buildup
- Control failure: valve sticking, actuator malfunction, or sensor signal loss
- Refrigerant charge loss (cooling systems only): requires specialist diagnosis
Corrective Actions: Clean fouled surfaces, clear blockages, verify sensor functionality, or escalate to specialized technicians
Pressure Deviation Diagnosis
Symptom: System pressure deviates >10% from baseline under identical load conditions
Diagnostic Sequence:
1. Verify pressure gauge calibration against a precision reference instrument
2. Confirm load conditions: equipment runtime, ambient temperature, system configuration
3. Install differential pressure transmitter across major components if not already installed
4. Measure differential pressure across:
- Filters or strainers
- Heat transfer equipment
- Control valves
- Piping sections
5. Compare component differential pressures against design specifications
6. Identify the component(s) causing overall pressure deviation
Corrective Actions: Clean or replace filters, perform chemical cleaning of fouled surfaces, test and repair control valves, or investigate piping for partial blockages
Flow Rate Anomalies
Symptom: System flow rate decreases despite maintained pressure
Diagnostic Sequence:
1. Verify baseline flow data and current operating conditions match
2. Use Dwyer Metal average flow probe MAFS-16 to measure flow across distribution sections
3. Calculate percentage decrease: (baseline flow - current flow) / baseline flow × 100
4. Investigate potential causes:
- Partial blockage in distribution ducts or piping
- Damper or valve partially closed
- Fan or pump bearing degradation
- Impeller damage or fouling
5. Perform visual inspection of accessible components
Corrective Actions: Clear blockages, verify damper and valve positions, perform vibration analysis on rotating equipment, or escalate to specialist technicians
Section 4: Documentation and Continuous Improvement
Measurement Data Management
Effective maintenance relies on systematic data collection and analysis. Implement:
- Daily logs: Record key measurements in standardized format
- Weekly summaries: Compare current readings to baseline; flag deviations >5%
- Monthly reports: Trend analysis identifying gradual degradation patterns
- Seasonal reviews: Evaluate whether environmental adjustments are needed
Calibration and Verification Schedule
Measurement instruments lose accuracy over time, especially in high-humidity Southeast Asian environments. Establish calibration protocols:
- PT100 RTD probes: Annual verification against reference standard; monthly functional checks
- Pressure gauges: Annual calibration by certified service provider; monthly accuracy verification
- Differential pressure transmitters: Calibration every 18 months; functional testing quarterly
- Flow probes: Visual inspection monthly; calibration annually
Maintain calibration certificates in equipment maintenance files for compliance documentation.
Building Institutional Knowledge
Each diagnostic performed generates lessons that strengthen future maintenance:
- Document the failure mode, root cause, and corrective action taken
- Record time required for diagnosis and repair
- Note whether the issue recurred and at what interval
- Share findings with other maintenance teams across your organization
Over 12-24 months, this accumulated knowledge enables predictive maintenance that identifies failing components 2-4 weeks before failure, rather than reacting after equipment stops functioning.
Conclusion
Measurement & Detection capabilities empower maintenance teams to transition from reactive troubleshooting to proactive system management. In Southeast Asia's challenging environmental conditions, precise baseline establishment, continuous monitoring integration, and systematic diagnostic protocols separate world-class operations from facilities plagued by unexpected downtime.
3G Electric's 35+ years distributing measurement and detection equipment across industrial facilities positions us to support your team with the right instruments and technical guidance. The protocols in this guide have proven effective across thousands of installations from Jakarta to Bangkok, Singapore to Manila.
Your next step: Audit your current measurement infrastructure. Identify gaps where decisions are made without adequate data. Deploy appropriate instrumentation from 3G Electric's comprehensive portfolio, establish baselines within 12 weeks, and begin monitoring. Within six months, you'll observe the dramatic reduction in emergency maintenance calls that characterizes truly predictive maintenance operations.
![Airstat Buyer's Guide SG | TAT Broth Media [2026]](https://oxalncjenpflyqfncuhe.supabase.co/storage/v1/object/public/product-assets/grainger/62314438-78dc-4409-9813-a921ea1b50c8.jpg)