Measurement & Detection for Preventive Maintenance Planning: A Maintenance Team's Strategic Guide to Condition-Based Equipment Care in Singapore
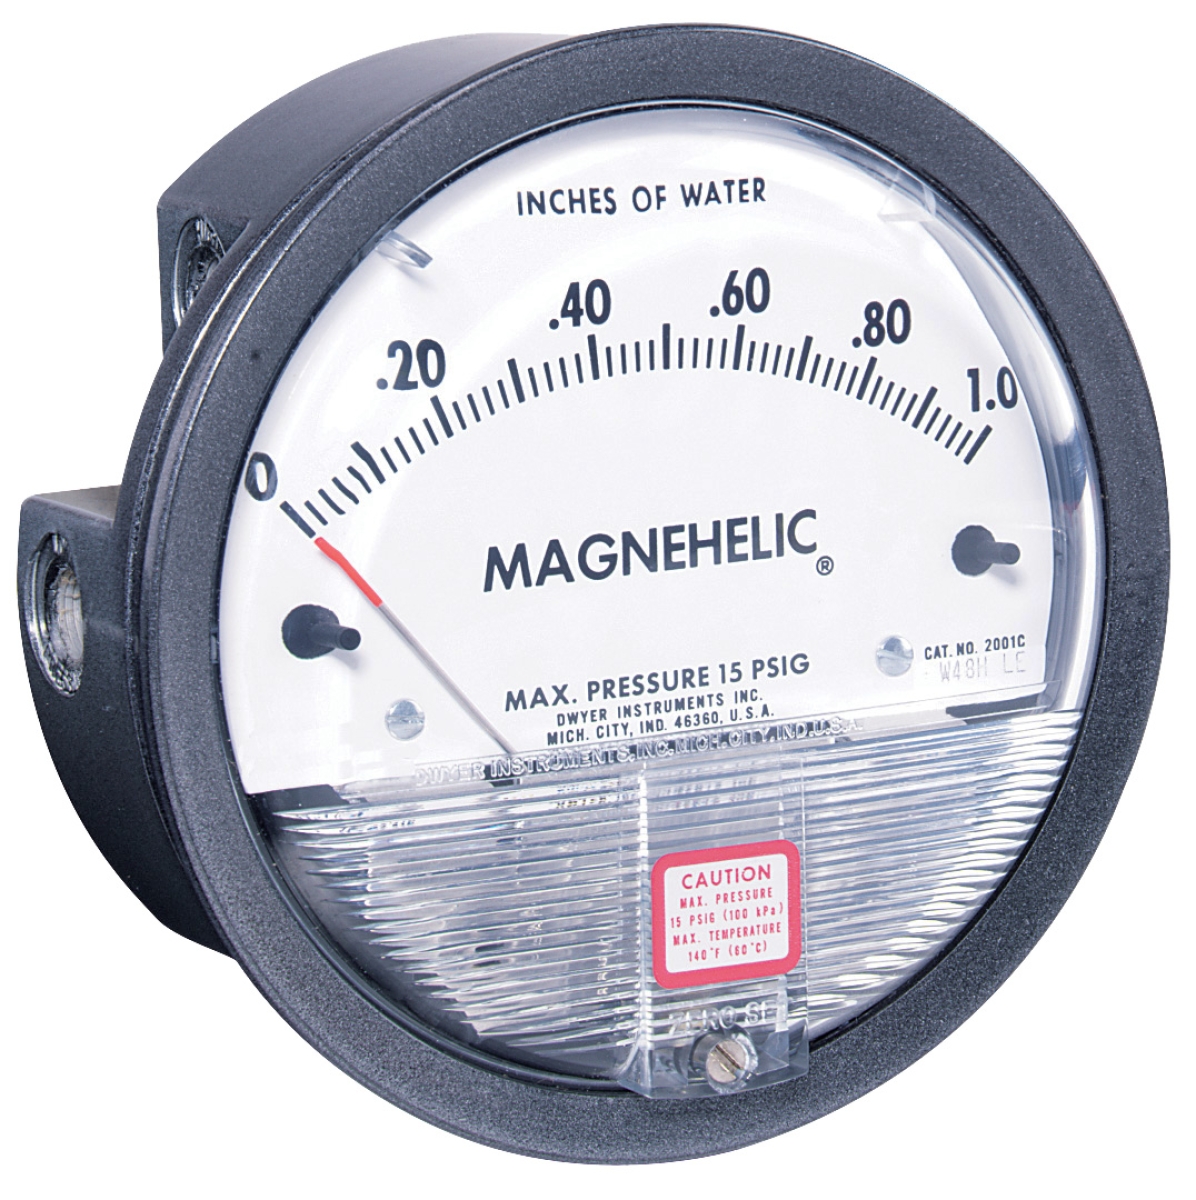
Table of Contentsexpand_more
Measurement & Detection: The Foundation of Condition-Based Maintenance
Measurement & Detection technologies are critical for maintenance teams seeking to move beyond scheduled service intervals toward true condition-based maintenance (CBM). Rather than replacing components on a calendar, effective measurement allows you to understand actual equipment health in real time, extending asset life and reducing unplanned downtime.
With over 35 years of experience distributing industrial measurement equipment across Asia-Pacific, 3G Electric has supported maintenance teams in refining their condition-monitoring strategies. The most successful programs use a combination of pressure measurement, temperature detection, and differential flow analysis to establish baseline performance data, then track deviations that signal wear, contamination, or system imbalance.
For Singapore's competitive manufacturing and facilities management sector, where downtime costs are high and space constraints demand efficiency, this approach delivers measurable ROI through extended equipment intervals, reduced emergency repairs, and optimized energy consumption.
Establishing Baseline Measurements for Your Equipment Portfolio
The first practical step is capturing baseline performance data across critical systems. This requires selecting the right measurement instruments for each application and establishing consistent monitoring points.
Pressure Monitoring as a Diagnostic Baseline
For fluid systems and pneumatic equipment, baseline pressure readings form the foundation of condition assessment. The Preciman Green ABS pressure gauge D80 0/+10bar provides ±2.5% full-scale accuracy with a 4-inch dial, making it suitable for installation on hydraulic lines, air compressors, and process equipment. Maintenance teams should record readings at startup, under normal load, and under peak demand to establish your equipment's healthy operating envelope.
Differential pressure monitoring is equally valuable. The Dwyer Magnehelic 2000-300PA pressure gauge measures differential pressure across filters, coils, and ducts with a 101.6 mm dial and 1/8" NPT connections. For example, tracking differential pressure across air filters lets you predict replacement timing before blockage reduces system efficiency—typically when differential pressure reaches 60–70% of maximum rated value.
Temperature Detection for Thermal Condition Assessment
Equipment degradation often manifests as temperature rise before mechanical failure occurs. The Preciman Green vertical thermometer D80 -30/+50°C with 10 cm thermowell allows accurate measurement of process fluid and bearing temperatures across industrial equipment. Install thermometers on motor windings, bearing housings, and hydraulic return lines to establish normal operating temperatures under various load conditions.
Temperature trends reveal critical information: a 5–10°C rise above baseline on a bearing suggests lubrication breakdown; elevated discharge temperatures on compressors indicate cooling system decline. Capturing these measurements weekly during normal operations builds data that predicts maintenance needs 2–4 weeks in advance.
Airflow and System Balance Detection
For HVAC and ventilation systems, the Dwyer Static pressure port stainless A-302F-C enables measurement of static pressure at duct locations, essential for verifying ductwork balance and detecting blockages. Combined with velocity measurements at supply and return points, static pressure readings confirm whether your HVAC system maintains design performance or whether duct leakage, filter loading, or damper drift has degraded airflow.
Implementing a Systematic Measurement Schedule
Consistent data collection transforms measurement tools from diagnostic devices into predictive assets. Establish a maintenance measurement schedule that balances thoroughness with operational feasibility.
Daily Quick-Check Protocol
Assign one technician to conduct 15-minute walkarounds recording pressure and temperature data from critical points using standardized log sheets. For example:
- Compressor discharge pressure (should remain stable within 0.5 bar)
- Motor bearing temperatures (record in Celsius to nearest degree)
- HVAC return duct differential pressure across filters (watch for 10% week-to-week increases)
This daily habit costs minimal time but catches rapid degradation before catastrophic failure.
Weekly Deep Measurement for Systems Under Load
Once weekly, during normal production hours when equipment runs under typical demand, conduct comprehensive measurements across all monitored points. This captures equipment behavior under real-world conditions rather than idle state readings. Use the Dwyer Magnehelic pressure gauge 2000-8KPA for low-pressure HVAC systems and cleanroom monitoring where 0–8 kPa differential pressure is typical. Record data in spreadsheets with timestamps, ambient conditions, and production load levels to enable trend analysis.
Monthly Trending Analysis and Intervention Planning
Review the four weeks of collected data to identify:
- Equipment readings drifting beyond normal variance (typically ±5% from baseline)
- Temperature gradients developing between similar components (suggests imbalance)
- Pressure fluctuations that indicate valve or seal degradation
When a measured parameter approaches defined intervention thresholds, schedule maintenance during planned shutdowns rather than waiting for failure. For example, if bearing temperature rises from baseline 65°C to 72°C over six weeks, plan bearing replacement within 2–3 weeks rather than at the next calendar interval.
Translating Measurements Into Maintenance Decisions
Measurement data only delivers value when it drives clear maintenance actions. Establish decision rules that tie specific readings to maintenance interventions.
Pressure-Based Maintenance Triggers
- Compressor discharge pressure rising 1–2 bar above baseline: Schedule valve inspection and cleaning; indicates discharge valve stiction or cooling system fouling
- Differential pressure across filter increasing 25% from last measurement: Plan filter replacement within 5 working days; prevents downstream contamination
- HVAC static pressure swinging ±15% from setpoint: Conduct duct leakage inspection and damper calibration; indicates balance degradation
Document these decision rules in your maintenance management system so that technicians in the field have clear guidance on when measurements justify intervention.
Temperature-Based Intervention Points
- Bearing temperature rising 8–10°C above baseline: Relubricate bearing immediately; monitor daily until temperature stabilizes
- Motor winding temperature exceeding 50°C above ambient: Reduce load, inspect cooling vents for blockage, schedule motor thermal imaging
- Hydraulic return line temperature persistently above 60°C: Inspect cooler performance and fluid condition; elevate system temperature accelerates fluid oxidation and seal degradation
The most predictive maintenance programs use multiple measurements together. For example, if both compressor discharge pressure and outlet temperature rise simultaneously, the root cause differs from either reading alone: combined pressure + temperature rise suggests heat exchanger fouling, while pressure rise with stable temperature indicates discharge valve issues. Train your team to read measurement patterns, not individual data points.
Building a Measurement Culture Within Your Maintenance Team
Long-term success requires moving beyond measurement as a compliance task toward a team culture where data-driven decisions guide daily work.
Equipment-Specific Measurement Proficiency
Assign team members to "own" specific systems and build expertise in their measurement signatures. The technician responsible for compressed air should understand why dryer outlet pressure differs from compressor discharge pressure, and what combinations of measurements indicate dryer saturation versus membrane fouling. This distributed knowledge creates resilience and reduces dependence on external consultants.
Documentation and Knowledge Transfer
Maintain historical measurement records for at least 24 months per equipment asset. When experienced technicians retire or transfer, their intuition about "normal" performance must transfer to successors through documented baseline data. Annotate measurement logs with notes about corrective actions taken—"replaced discharge valve on 2025-01-15, pressure immediately dropped 0.8 bar"—so future trends reference actual interventions.
Tool Calibration and Measurement Confidence
Ensure all pressure gauges and thermometers are calibrated annually by certified services. Measurement instruments from 3G Electric suppliers like Dwyer and Preciman are designed for industrial durability, but calibration drift is inevitable. A gauge reading 2–3% high or low corrupts your entire trend analysis and may trigger unnecessary maintenance. Budget for annual calibration as part of your measurement infrastructure cost.
Conclusion
Measurement & Detection instruments transform maintenance from reactive problem-solving into proactive system stewardship. By systematically capturing pressure, temperature, and differential flow data, your team establishes an early-warning system that extends equipment life, improves reliability, and optimizes operating costs across your Singapore facility.
Begin with one critical system—perhaps your main air compressor or central HVAC unit—and establish baseline measurements over 4–6 weeks. Once your team gains confidence in the process, expand to additional equipment. The cumulative reliability improvement and downtime reduction justify the modest investment in quality measurement instruments and trained personnel.
3G Electric's 35+ years of experience supplying industrial measurement equipment across Asia-Pacific positions us to support your condition-based maintenance transformation with products engineered for industrial accuracy and durability.
![Airstat Buyer's Guide SG | TAT Broth Media [2026]](https://oxalncjenpflyqfncuhe.supabase.co/storage/v1/object/public/product-assets/grainger/62314438-78dc-4409-9813-a921ea1b50c8.jpg)