Measurement & Detection for Real-Time System Performance Optimization: A Plant Manager's Operational Guide
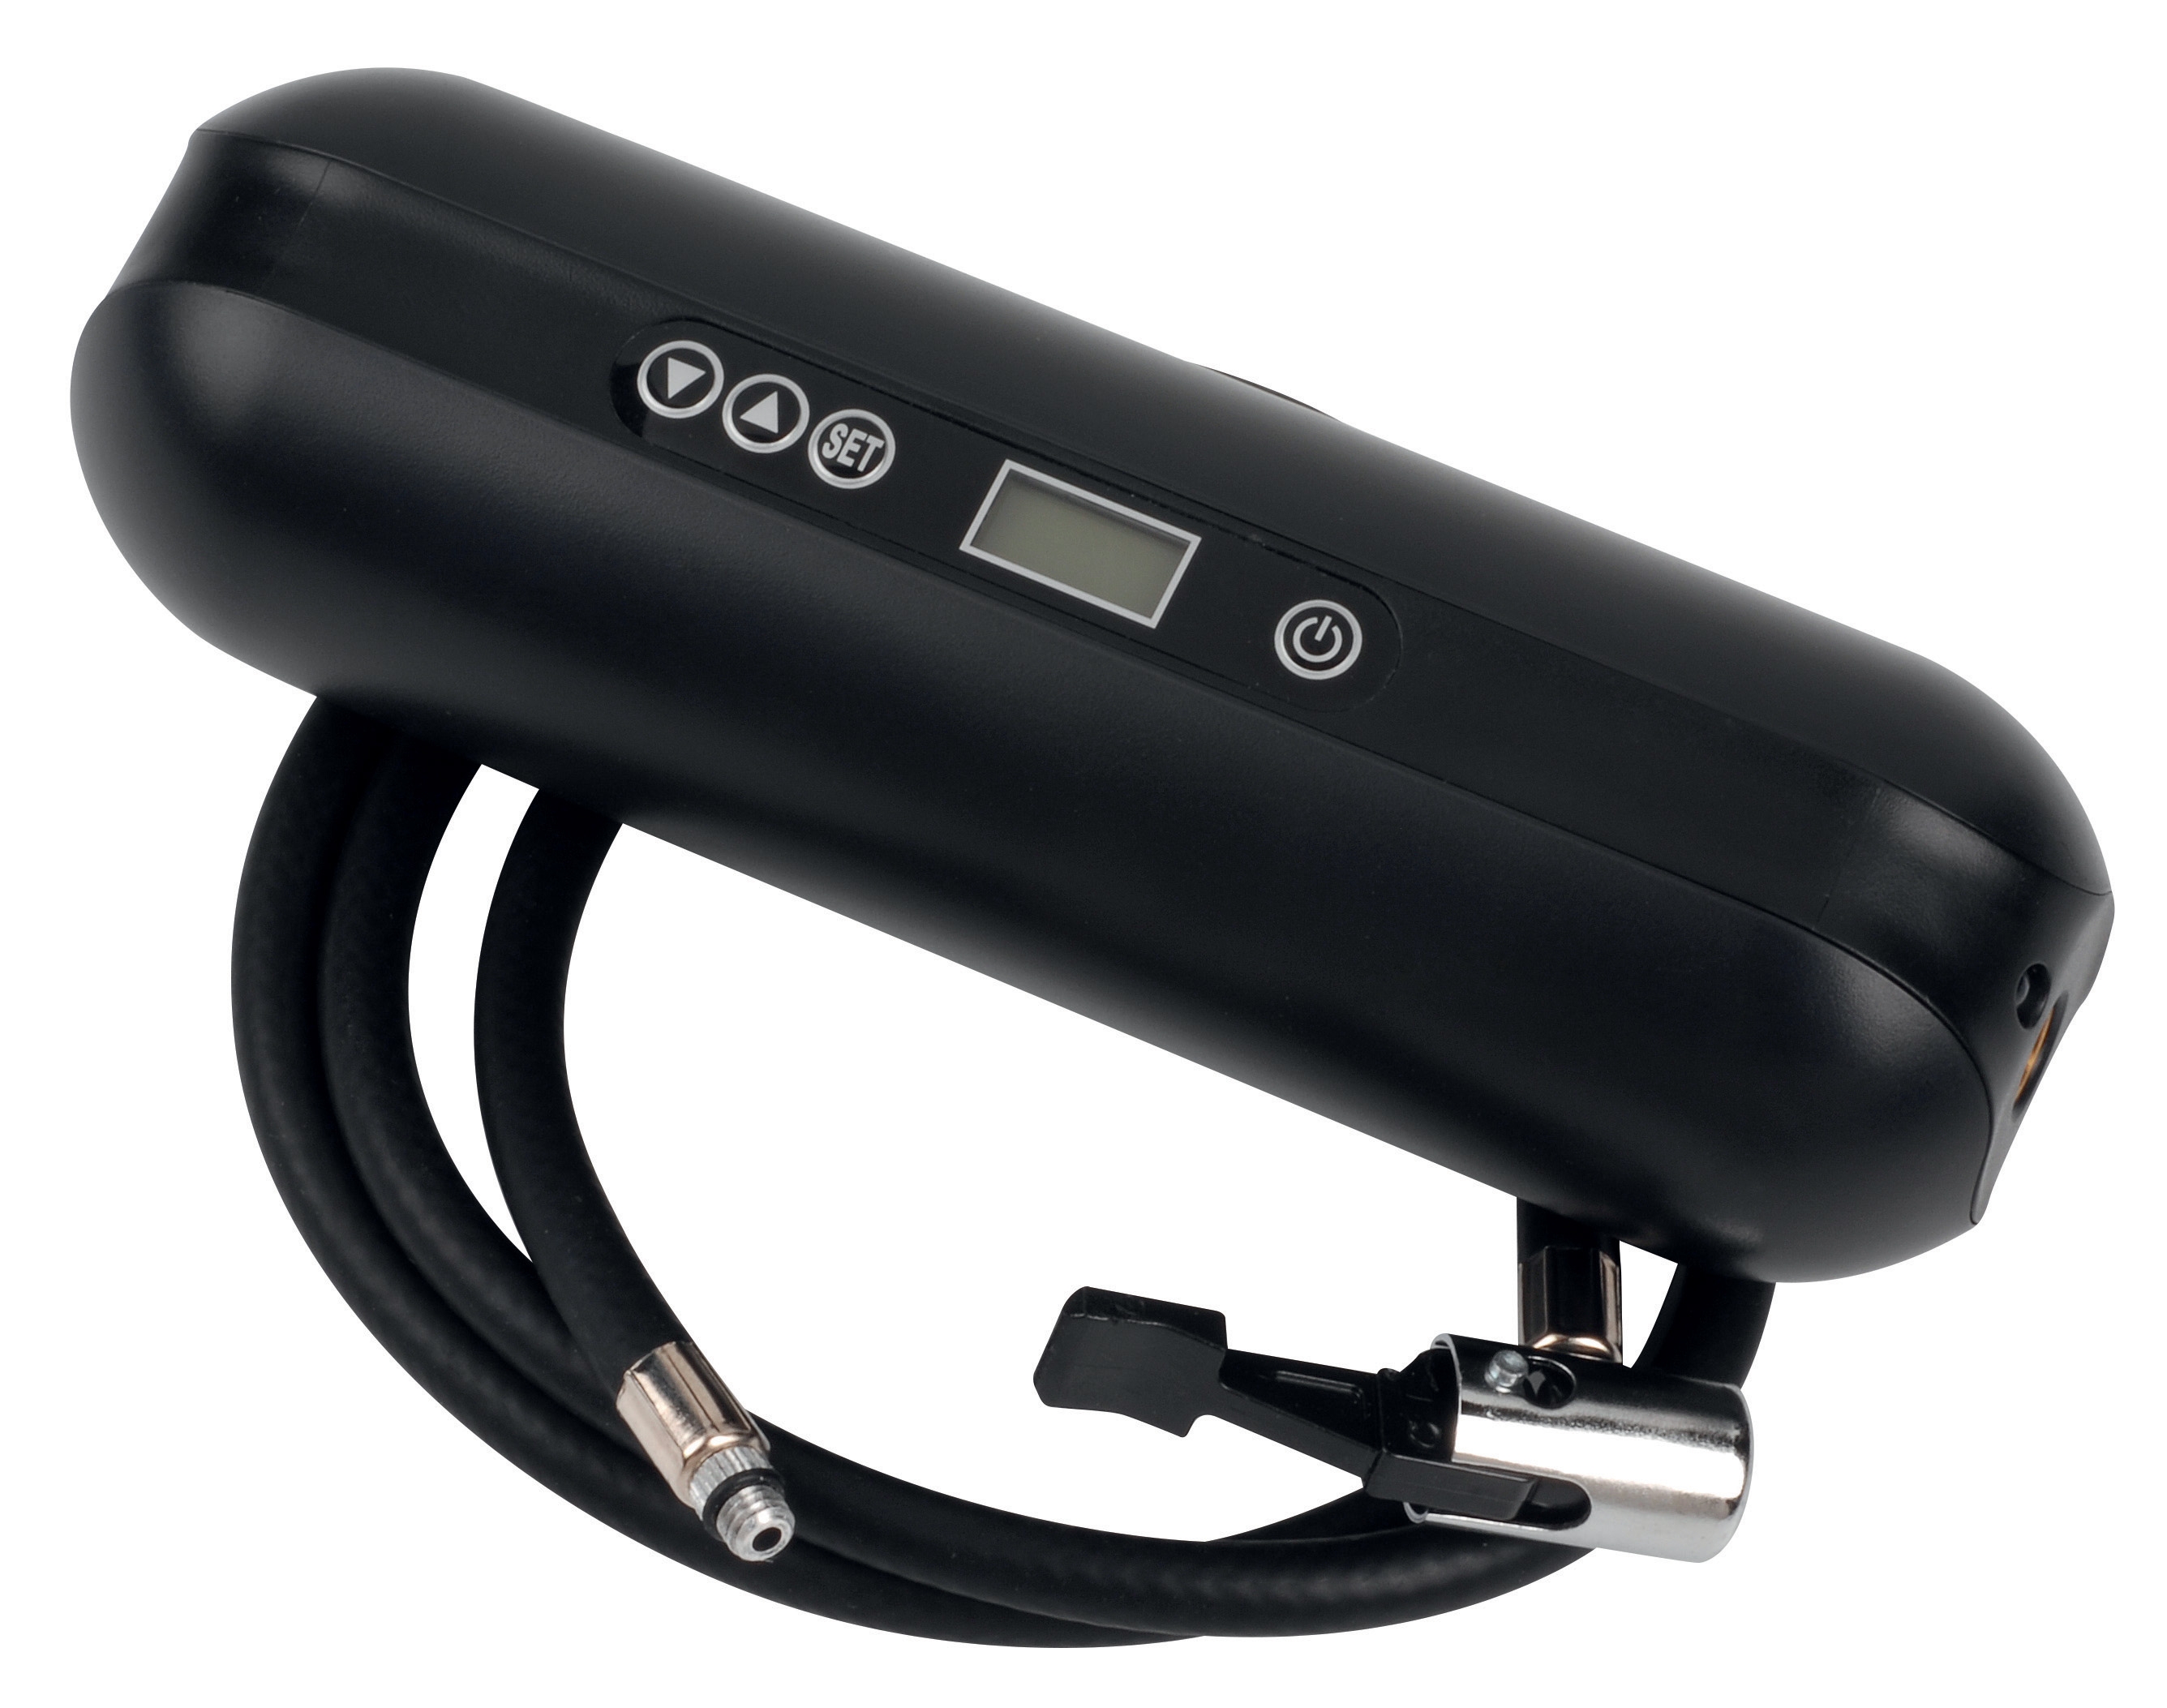
Table of Contentsexpand_more
Introduction: Why Real-Time Measurement & Detection Matters for Your Operations
Measurement & Detection systems form the nervous system of modern industrial facilities. For plant managers, the ability to monitor multiple parameters simultaneously—pressure, temperature, flow rates, and system health—transforms maintenance from reactive to predictive and operational decisions from guesswork to science.
Over 35 years of industrial equipment distribution, 3G Electric has supported Singapore's plant managers in implementing measurement systems that reduce unplanned downtime by 30-40%. The difference between facilities that operate at peak efficiency and those that struggle with recurring issues often comes down to one critical factor: the quality and comprehensiveness of real-time data collection.
This guide walks you through establishing a measurement and detection framework that provides continuous visibility into system performance, enabling you to optimize operations, extend equipment life, and maintain regulatory compliance across your facility.
Section 1: Designing Your Multi-Parameter Measurement Strategy
Effective measurement and detection begins with understanding what you need to know. Rather than installing sensors everywhere, successful plant managers design a strategic measurement framework that captures the most critical performance indicators for their specific operations.
Identify Your Critical Measurement Points
Start by mapping your HVAC and industrial systems to identify where measurement provides the highest operational value:
- Pressure monitoring: Expansion tanks, refrigerant lines, compressed air systems, and distribution networks require continuous pressure supervision to prevent failures and optimize efficiency
- Temperature tracking: Supply and return air temperatures, process fluid temperatures, and equipment operating temperatures reveal system efficiency and potential problems
- Flow measurement: Air and liquid flow rates indicate whether distribution systems are performing as designed and help identify blockages or distribution imbalances
- System health indicators: Pressure differentials, temperature differentials, and flow relationships show overall system performance
For expansion tank systems, the CBM Expansion Tank Inflator Battery 2000 mAH provides integrated pressure monitoring across your HVAC infrastructure. This tool enables you to verify tank pre-charge pressures and system operating pressures regularly, preventing the thermal expansion failures that often strike during peak demand periods.
Establish Baseline Performance Metrics
Before implementing real-time detection systems, establish what "normal" looks like for your operations:
- Document typical pressure ranges during standard operation and peak demand
- Record temperature differentials across major components
- Measure baseline flow rates and note seasonal variations
- Track these metrics weekly for at least one month to create reliable baselines
These baselines become your detection trigger points. When real-time measurements deviate significantly from baseline, your detection system alerts you to investigate, catching problems when they're still manageable.
Section 2: Implementing Pressure and Temperature Detection Systems
Pressure and temperature represent the two most critical parameters in industrial facilities. These measurements reveal system loading, efficiency, and impending failures with remarkable accuracy.
Pressure Detection Across Critical Points
For HVAC systems and compressed air networks, multi-point pressure detection prevents catastrophic failures and optimizes performance:
The Dwyer Transmitter 616KD-13V-TC provides differential pressure measurement critical for HVAC applications, measuring pressure differentials across filters, coils, and ductwork. This 0–1 IN W.C. differential transmitter helps you detect:
- Filter clogging: Rising differential pressure across filters signals maintenance needs before airflow becomes restricted
- Coil fouling: Increased pressure drop across heating or cooling coils indicates buildup requiring cleaning
- Duct blockages: Unusual pressure relationships identify obstructions in distribution networks
- System imbalance: Comparative measurements across parallel branches reveal distribution problems
For low-pressure industrial monitoring and visual reference, the Preciman Stainless Steel Vertical Pressure Gauge D63 0/+40Mbar G1/4 offers ±1.6% accuracy in a durable stainless steel package suitable for Singapore's humid industrial environment. Install these gauges at key system points—tank connections, pump discharge, and main distribution lines—to provide immediate visual confirmation that electronic sensors validate.
Temperature Detection for Efficiency and Safety
Temperature measurement enables you to verify system performance and detect inefficiencies before they compound:
The Dwyer Probe AVG PT100 OHM RTD L.65 AVG-21241 provides ±0.6% accuracy across -35.5°C to +115.5°C, making it ideal for comprehensive industrial temperature monitoring. Install PT100 probes at:
- Supply air leaving cooling/heating units (verify equipment performance)
- Return air entering equipment (establish system load)
- Chilled water supply and return (calculate cooling capacity delivery)
- Hot water supply and return (verify heating system efficiency)
- Outdoor air temperature (reference for performance calculations)
These measurements reveal efficiency degradation. A cooling system maintaining constant supply temperature while return temperatures climb indicates reduced equipment capacity. A heating system with narrowing temperature differential suggests fouled heat exchangers.
Real-Time Analysis: From Raw Data to Actionable Insight
Raw measurements only become valuable through interpretation. Establish decision rules:
- Alert thresholds: Define pressure and temperature limits that trigger investigation (not shutdown—investigation)
- Trend analysis: Monitor whether parameters are stable, slowly drifting, or changing rapidly
- Differential relationships: Compare supply vs. return temperatures and pressures to calculate actual system performance
- Time-based patterns: Note if issues occur during specific times (peak demand, cooling cycles, external temperature changes)
Section 3: Flow Measurement and System Distribution Verification
Flow measurement validates whether your system is actually delivering the capacity it was designed for. Many facilities operate with significant flow imbalances that go undetected, wasting energy and creating comfort issues.
Average Flow Measurement for HVAC Systems
The Dwyer Metal Average Flow Probe MAFS-16 measures static and total pressure across 16 cm of probe length, providing reliable flow measurement in air distribution systems. This probe enables you to:
- Verify duct flow rates: Measure actual air velocity and confirm design airflow is being delivered
- Identify distribution problems: Compare flow at different duct branches to detect blockages or damper issues
- Optimize balancing: Make data-driven decisions about adjusting dampers and louvers
- Validate upgrade benefits: Confirm that ductwork cleaning or filter replacement actually improves flow
Implement flow measurement at strategic locations:
- Main supply duct: Establishes baseline total system flow
- Major branches: Reveals distribution imbalance
- Return air ducts: Confirms system is actually pulling air back (detecting duct leaks)
- Equipment discharge: Verifies fans and blowers are performing as rated
When combined with pressure and temperature data, flow measurements enable flow-pressure-temperature balance calculations that reveal your system's actual capacity versus design capacity.
Section 4: Creating Your Measurement & Detection Action Protocol
The final element of successful measurement and detection is translating data into action. Many facilities collect excellent data but fail to establish clear protocols for response.
Establish Measurement Frequency and Reporting
Different measurements require different intervals:
- Continuous automated measurement (electronic transmitters): Pressure, temperature across critical points logged every 15-60 minutes
- Weekly manual verification (pressure gauges, visual inspection): Confirm electronic sensors match physical indicators
- Monthly trend analysis: Review logged data for drift, cycling patterns, or developing problems
- Quarterly baseline verification: Recalibrate expectations based on seasonal changes
- Annual system commissioning: Verify entire measurement system accuracy and completeness
Establish clear procedures:
1. Detection: Automated system flags data points outside acceptable ranges
2. Verification: Technician confirms anomaly with on-site measurements and visual inspection
3. Investigation: Determine root cause (is sensor faulty, or is system actually abnormal?)
4. Intervention: Execute appropriate response (cleaning, adjustment, repair, or replacement)
5. Documentation: Record findings and actions to build historical performance database
6. Adjustment: Use findings to refine baseline expectations and alert thresholds
Building Your Measurement System Over Time
You don't need to implement every measurement point simultaneously. Successful plant managers prioritize based on:
- Risk level: Systems prone to unexpected failure get measured first
- Operational impact: High-consequence systems (critical cooling, backup power) require comprehensive measurement
- Energy consumption: Systems consuming significant energy justify investment in efficiency monitoring
- Historical problems: Systems with recurring issues need measurement to diagnose root causes
With 35+ years supporting Singapore industrial operations, 3G Electric has helped hundreds of plant managers develop measurement strategies that pay for themselves through reduced downtime and optimized efficiency. Start with 4-6 critical measurement points, master the data interpretation, then expand systematically.
Conclusion: Making Measurement and Detection Work for Your Plant
Measurement & Detection systems transform industrial operations from intuition-based to data-driven. The combination of differential pressure transmitters, temperature probes, pressure gauges, and flow measurement equipment creates the visibility needed for continuous optimization.
Your competitive advantage as a plant manager increasingly depends on how effectively you translate raw measurements into operational decisions. Whether you're optimizing HVAC efficiency, preventing expansion tank failures, or validating system performance, comprehensive measurement and detection provides the information foundation for excellence.
3G Electric supplies the quality equipment—transmitters, probes, gauges, and diagnostic tools—that make this possible. More importantly, our 35+ years in industrial equipment distribution means we understand the practical challenges plant managers face implementing these systems in real-world operations.
![Airstat Buyer's Guide SG | TAT Broth Media [2026]](https://oxalncjenpflyqfncuhe.supabase.co/storage/v1/object/public/product-assets/grainger/62314438-78dc-4409-9813-a921ea1b50c8.jpg)