Controls & Safety: Asset Reliability and Performance Monitoring for Singapore Industrial Plants
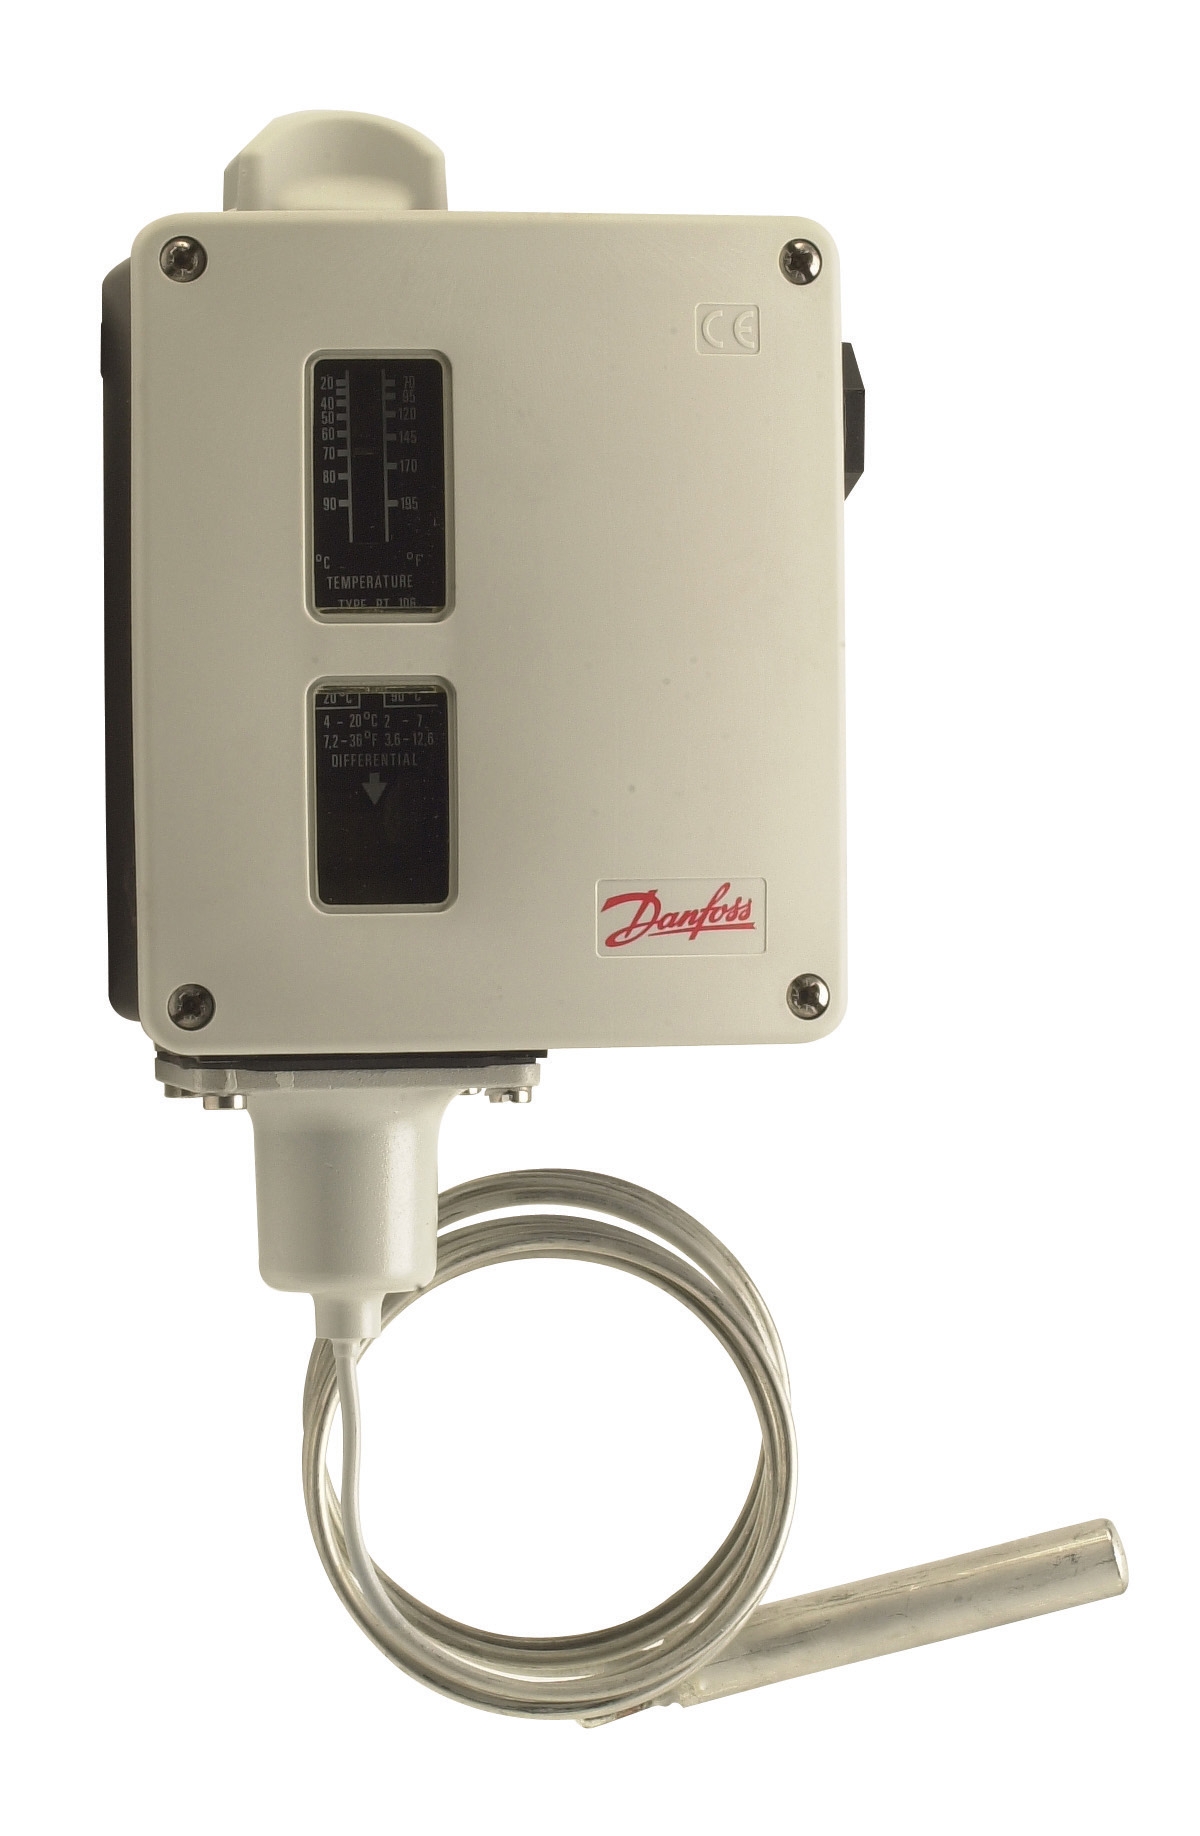
Table of Contentsexpand_more
Introduction: Controls & Safety as a Strategic Asset Management Tool
Controls & Safety systems are no longer passive protection mechanisms—they are active intelligence platforms that drive plant profitability. For plant managers in Singapore, where operational efficiency directly impacts competitiveness in global markets, understanding how to leverage Controls & Safety data for asset management is critical.
With over 35 years of experience distributing industrial equipment across Southeast Asia, 3G Electric has observed a fundamental shift in how leading plants view Controls & Safety infrastructure. Rather than treating these systems as compliance checkboxes, top-performing facilities use them as strategic tools for equipment longevity, energy optimization, and workforce safety integration.
This guide focuses on practical asset reliability strategies that transform Controls & Safety investments into measurable operational improvements.
Section 1: Real-Time Performance Monitoring and Early Fault Detection
Moving Beyond Reactive Maintenance
Traditional maintenance models rely on scheduled intervals or catastrophic failures—both approaches waste capital. Real-time monitoring of your Controls & Safety systems provides continuous visibility into equipment condition, enabling you to detect degradation before it impacts production.
Temperature control devices like the Danfoss Thermostat RT 124 and Danfoss Thermostat RT 107 generate critical performance data when properly integrated into a monitoring framework. These thermostats track differential changes and contact cycling patterns that reveal bearing wear, thermal gradients, and control precision loss—all precursors to failure.
Implementing Sensor Data Integration
Your Controls & Safety infrastructure already contains dozens of measurement points. The key is extracting actionable intelligence:
- Temperature deviation patterns: Track how your thermostats respond to setpoint changes. Increased response time indicates internal component degradation or sensor drift.
- Contact cycling frequency: Counting relay operations reveals system stress. Excessive cycling suggests control instability or process oscillation.
- Control signal timing: Measure the lag between demand signals and output response. Deteriorating response indicates amplifier or control module fatigue.
Flame detection systems exemplify this opportunity. The Honeywell Cell C 7044 A 1006 ultraviolet flame detector paired with the Honeywell Amplifier R 7861 A 1026 generates measurable signal strength data. Declining signal-to-noise ratios over months signal optical window contamination, electronic component drift, or imminent detector failure—all detectable weeks before operational failure.
Data Collection Without Disruption
Implementing monitoring doesn't require system shutdowns. Modern distributed control architectures allow parallel data logging:
- Install temporary data loggers across key control points during normal operation
- Capture baseline performance signatures under stable operating conditions
- Document seasonal variations (critical in Singapore's tropical climate where ambient temperature fluctuations impact HVAC system behavior)
- Establish alert thresholds based on 15-20% degradation from baseline
Section 2: Condition-Based Maintenance Strategy and Component Lifecycle Optimization
Moving From Time-Based to Condition-Based Schedules
Singapore's high-cost labor environment makes maintenance efficiency paramount. Condition-based maintenance (CBM) allows you to extend healthy component life while replacing degraded units before failure impacts production.
Consider the Pactrol CSS01 12 housing control module. Traditional practice dictates replacement at fixed intervals (typically 5 years for critical burner control systems). CBM enables data-driven decisions:
- Electronic component aging: Measure supply voltage stability, switching speed, and thermal performance. Drift in any parameter indicates capacitor degradation or junction leakage typical of 7-10 year lifespans under tropical conditions.
- Relay contact degradation: Count switching cycles and measure contact resistance. Industrial relays typically provide 500,000-1,000,000 cycles before contact erosion impacts reliability.
- Spark generator performance: Monitor ignition signal timing and output voltage. Declining spark energy indicates electrode gap opening or transformer winding insulation breakdown.
Building a Component History Database
Effective CBM requires institutional knowledge. Create a simple database tracking:
For each critical control component:
- Installation date and operating hours
- Recorded baseline performance metrics (contact resistance, response time, signal strength)
- Monthly condition monitoring results
- Any anomalies or maintenance events
- Final retirement date and failure mode (if failed) or disposal reason (if replaced preventively)
This database becomes invaluable for:
- Identifying long-lived vs. short-lived supply chains
- Predicting component replacement timing for budget planning
- Justifying premium components with superior longevity
- Training new maintenance staff on your equipment's actual reliability patterns
Seasonal Adjustment Strategies
Singapore's equatorial climate creates unique challenges for Controls & Safety systems. High humidity and temperature stability differ dramatically from temperate regions where most equipment is designed and tested.
Temperature consideration: Equipment rated to 60°C ambient (typical for HVAC systems) operates near maximum limits during Singapore's peak seasons. This accelerates component aging by 50-100% compared to cooler climates. Adjust your baseline performance expectations downward and increase monitoring frequency during high-ambient periods.
Humidity management: The 80-95% relative humidity typical of Singapore's rainy season demands:
- More frequent cleaning of optical surfaces on flame detectors
- Shortened intervals for contact resistance measurement (condensation changes contact interface conditions)
- Enhanced maintenance for spark generators (moisture degrades insulation)
Section 3: Integration of Safety Data into Operational Decision-Making
Safety Performance as a Leading Indicator of Equipment Health
Safety system data reveals operational insights far beyond compliance. Flame detection events, unauthorized shutdowns, and control faults create a chronological record of equipment stress.
When your Honeywell Cell C 7044 A 1006 or Honeywell Amplifier R 7861 A 1026 triggers unnecessary flame loss signals, the root cause is rarely the detector itself. Common precursors:
- Fuel supply instability: Fluctuating oil pressure or gas flow triggers edge-case flame detection, indicating pump wear or regulator drift
- Combustion chamber fouling: Incomplete combustion deposits reduce flame luminosity, forcing detectors to operate near sensitivity limits
- Air/fuel ratio degradation: Dirty burner tips or intake filters cause flame instability that safety systems correctly identify
Each false alarm represents a maintenance opportunity disguised as a safety event.
Emergency Shutdown Analysis for Predictive Maintenance
Track every shutdown event—planned or emergency—and categorize the root cause:
- Control signal faults: Indicates thermostat, amplifier, or wiring degradation
- Flame loss during stable operation: Points to detector, fuel supply, or burner condition
- Operator shutdowns: Document the reason; patterns reveal chronic process instability
Singapore's regulatory environment (PUB standards for steam systems, WSH Act for safety) mandates shutdown documentation. Leverage these records:
1. Trend analysis: Three flame loss events in six months signals detector or combustion problem requiring intervention
2. Root cause correlation: Cross-reference shutdown events with temperature logs, fuel pressure records, and combustion data
3. Predictive replacement timing: When shutdown frequency exceeds one per month, schedule preventive replacement during planned maintenance windows
Operator Feedback Integration
Your operators interact with Controls & Safety systems constantly. Create a structured feedback mechanism:
- Weekly toolbox talks: Ask operators about response time changes (thermostats responding slowly), unusual clicking patterns (relay wear), or ignition hesitation (spark generator degradation)
- Maintenance request analysis: "Burner won't light first attempt" typically indicates spark generator decline or fuel system pressure loss—both predictable via condition monitoring
- Safety culture alignment: When operators report borderline conditions before safety systems trigger, your CBM program is working
Section 4: Technology Selection and Monitoring Infrastructure
Choosing Controls & Safety Systems with Built-In Diagnostics
When procuring new equipment, prioritize systems that enable condition monitoring. Key features include:
Temperature control devices: The Danfoss RT 124 and Danfoss RT 107 offer:
- Visible indicator of contact position (enables visual inspection of switching)
- Adjustable differential settings (allows you to test responsiveness by intentionally adjusting setpoint)
- Changeover contact design (enables wiring of auxiliary monitoring circuits)
- Specified signal strength ranges (allows signal quality trending)
- Standardized amplifier outputs (enables integration with data acquisition systems)
- Proven field data on expected lifespans under various conditions
- Timed relay functions (measurable timing intervals reveal electronic component drift)
- Flame relay contacts (switching patterns indicate control system stress)
- Spark generator (ignition signal timing and voltage are measurable parameters)
Building a Monitoring Architecture on Singapore Budgets
Enterprise IoT platforms are expensive. Practical alternatives for plant managers:
Phase 1 (Low investment): Manual data logging
- Deploy digital multimeters with logging capability ($200-500 SGD)
- Train maintenance staff on measurement procedures
- Create simple spreadsheets tracking weekly or monthly readings
- Cost: Minimal; timeline: Implement in weeks
- Install temperature and current sensors on critical control lines
- Use low-cost wireless mesh networks (Zigbee, LoRaWAN) to transmit data
- Store data in simple cloud database (AWS, Azure low-tier)
- Cost: $2,000-5,000 SGD; timeline: 2-3 months for installation and validation
- Connect monitoring system to your existing SCADA or BMS infrastructure
- Deploy machine learning algorithms to predict failures 30-60 days in advance
- Generate automated maintenance work orders
- Cost: $10,000-25,000 SGD; timeline: 6-12 months including staff training
3G Electric's Role in Your Monitoring Program
With 35+ years supplying industrial equipment to Southeast Asia, 3G Electric provides:
- Component expertise: Our technical team understands typical failure modes for every thermostat, detector, and control module we supply
- Spare parts availability: Emergency replacement inventory ensures you can implement CBM without stock-outs
- Technical support: Our field engineers can validate your monitoring data and recommend component upgrades aligned with your condition-based strategy
Practical Implementation Roadmap
Months 1-2: Establish Baseline
- Document all Controls & Safety components in your facility
- Record current performance metrics (contact resistance, temperature response time, signal strength)
- Establish monitoring frequency (weekly for critical systems, monthly for secondary equipment)
- Implement Phase 1 data logging across priority systems
- Train maintenance team on measurement procedures
- Create condition monitoring database
- Review six weeks of trend data
- Establish alert thresholds based on your actual equipment performance
- Identify components showing early degradation signs
- Execute preventive replacements based on condition data
- Compare actual failure rates to scheduled maintenance model
- Calculate ROI from extended component life and prevented failures
- Plan Phase 2 technology upgrades
Conclusion
Controls & Safety systems represent some of the most valuable intelligence sources in your facility. Plant managers who transform these systems from compliance tools into asset reliability platforms gain competitive advantages through extended equipment life, reduced emergency maintenance, and optimized capital allocation.
Singapore's operational environment—with high labor costs, equipment import dependencies, and tropical climate challenges—makes this strategic approach essential. By implementing condition-based monitoring, integrating safety data into maintenance decisions, and selecting equipment that enables diagnostics, you position your plant for sustainable excellence.
The investment in Controls & Safety monitoring programs typically pays for itself within 18-24 months through avoided failures and optimized maintenance scheduling. For plant managers committed to operational excellence, this represents some of the highest-ROI investments available.
![Satronic Burner Controls SG | Buyer's Guide [2026]](https://oxalncjenpflyqfncuhe.supabase.co/storage/v1/object/public/product-assets/cbm/57d089e0-d3cf-4168-9f73-fb6bf7a7163b.jpg)